You can not select more than 25 topics
Topics must start with a letter or number, can include dashes ('-') and can be up to 35 characters long.
2.2 KiB
2.2 KiB
Hastic Graph Panel
A better version of Grafana's default Graph Panel. Able to render Anomalies & more.

Prerequisites
Installation
- Clone the repository
cd $GRAFANA_PATH/data/plugins
git clone git@github.com:hastic/hastic-grafana-graph-panel.git
- Restart
$GRAFANA_PATH/bin/grafana-serverserver.
Usage
hastic-server should be running in order to use anomaly detection.
- Open new dasboard where you want to see Hastic panel
- Open Dashboard
Settings(top right corner) and then navigate toVariables - Add new variable
- set
typetoConstant - set
nametoHASTIC_SERVER_URL - set
valueto URL of your hastic-server instance in your dashboard (e.g.http://localhost:8000)
- set
- Save settings and close Settings window
- Open panel edit mode (click
panel titlemenu or press "e" hotkey) - Navigate to
Metricstab. Set metrics. Only one metric suported - Navigate to
Analytics tab- Push
Add an Anomaly Typebutton - Set name of the anomaly and choose a pattern type
- Press
create
- Push
- Label your data:
- Click button with chart icon
- Highlight anomalies on graph holding
Ctrlbutton on Windows orCmdon Mac - When you have finished labeling - click the button with the chart icon once more.
saving...status should appear.
Learningstatus should appear while hastic-server is learning (first learning can take a while).- When
Learningstatus dissapears - the anomalies should become labeled in your graph 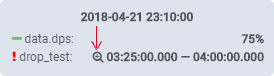 this icon means that the anomaly was marked by the server
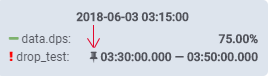 this icon means that the anomaly was marked by the user
Development
Build
npm install
npm run build
Changelog
[Improvements]
- You can zoom during update
Credits
Based on