# Hastic Graph Panel
A better version of Grafana's default Graph Panel. Able to render Anomalies & more.
 # Prerequisites
* [hastic-server](https://github.com/hastic/hastic-server)
* [Grafana >= 5.1.1](https://grafana.com/grafana/download)
# Installation
- Clone the repository
```
cd $GRAFANA_PATH/data/plugins
git clone git@github.com:hastic/hastic-grafana-graph-panel.git
```
- Restart `$GRAFANA_PATH/bin/grafana-server` server.
# Usage
[hastic-server](https://github.com/hastic/hastic-server) should be running in order to use anomaly detection.
- Open new dasboard where you want to see Hastic panel
- Open Dashboard `Settings` (top right corner) and then navigate to `Variables`
- Add new [variable](http://docs.grafana.org/reference/templating/#variable-types)
- set `type` to `Constant`
- set `name` to `HASTIC_SERVER_URL`
- set `value` to URL of your hastic-server instance in your dashboard (e.g. `http://localhost:8000`)
- Save settings and close Settings window
- Open panel edit mode (click `panel title`menu or press "e" hotkey)
- Navigate to `Metrics` tab. Set metrics. Only one metric suported
- Navigate to `Analytics tab`
- Push `Add an Anomaly Type` button
- Set name of the anomaly and choose a pattern type
- Press `create`
- Label your data:
- Click button with chart icon
- Highlight anomalies on graph holding `Ctrl` button on Windows or `Cmd` on Mac
- When you have finished labeling - click the button with the chart icon once more. `saving...` status should appear.
- `Learning` status should appear while hastic-server is learning (first learning can take a while).
- When `Learning` status dissapears - the anomalies should become labeled in your graph
-
# Prerequisites
* [hastic-server](https://github.com/hastic/hastic-server)
* [Grafana >= 5.1.1](https://grafana.com/grafana/download)
# Installation
- Clone the repository
```
cd $GRAFANA_PATH/data/plugins
git clone git@github.com:hastic/hastic-grafana-graph-panel.git
```
- Restart `$GRAFANA_PATH/bin/grafana-server` server.
# Usage
[hastic-server](https://github.com/hastic/hastic-server) should be running in order to use anomaly detection.
- Open new dasboard where you want to see Hastic panel
- Open Dashboard `Settings` (top right corner) and then navigate to `Variables`
- Add new [variable](http://docs.grafana.org/reference/templating/#variable-types)
- set `type` to `Constant`
- set `name` to `HASTIC_SERVER_URL`
- set `value` to URL of your hastic-server instance in your dashboard (e.g. `http://localhost:8000`)
- Save settings and close Settings window
- Open panel edit mode (click `panel title`menu or press "e" hotkey)
- Navigate to `Metrics` tab. Set metrics. Only one metric suported
- Navigate to `Analytics tab`
- Push `Add an Anomaly Type` button
- Set name of the anomaly and choose a pattern type
- Press `create`
- Label your data:
- Click button with chart icon
- Highlight anomalies on graph holding `Ctrl` button on Windows or `Cmd` on Mac
- When you have finished labeling - click the button with the chart icon once more. `saving...` status should appear.
- `Learning` status should appear while hastic-server is learning (first learning can take a while).
- When `Learning` status dissapears - the anomalies should become labeled in your graph
- 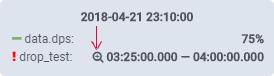 this icon means that the anomaly was marked by the server
-
this icon means that the anomaly was marked by the server
- 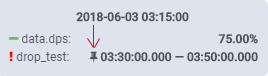 this icon means that the anomaly was marked by the user
# Development
## Build
```
npm install
npm run build
```
# Changelog
[Improvements]
* You can zoom during update
# Credits
Based on
* [grafana-plugin-template-webpack-typescript](https://github.com/CorpGlory/grafana-plugin-template-webpack-typescript)
* [@types/grafana](https://github.com/CorpGlory/types-grafana)
this icon means that the anomaly was marked by the user
# Development
## Build
```
npm install
npm run build
```
# Changelog
[Improvements]
* You can zoom during update
# Credits
Based on
* [grafana-plugin-template-webpack-typescript](https://github.com/CorpGlory/grafana-plugin-template-webpack-typescript)
* [@types/grafana](https://github.com/CorpGlory/types-grafana)