You can not select more than 25 topics
Topics must start with a letter or number, can include dashes ('-') and can be up to 35 characters long.
|
|
3 years ago | |
|---|---|---|
| src | 3 years ago | |
| .gitignore | 3 years ago | |
| .gitlab-ci.yml | 3 years ago | |
| .prettierrc.js | 3 years ago | |
| CHANGELOG.md | 3 years ago | |
| LICENSE | 3 years ago | |
| README.md | 3 years ago | |
| jest.config.js | 3 years ago | |
| package.json | 3 years ago | |
| tsconfig.json | 3 years ago | |
| yarn.lock | 3 years ago | |
README.md
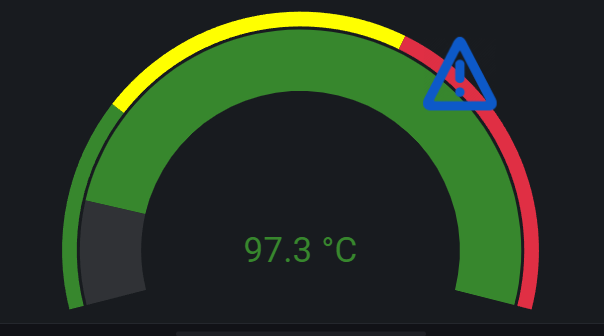
Grafana Chartwerk Panel (beta)
![]()
Grafana Chartwerk Panel renders metrics using Chartwerk libraries. For now, it can render as Gauge. We are working on adding new visualizations.
Features
- 3 types of visualizations:
- Gauge
- Line Chart (coming soon)
- Bar Chart (coming soon)
- Gauge: dynamic thresholds and min / max
- Gauge: conditional icons displaying
- Gauge: reversed direction
How to use
- Create a new panel and select Chartwerk as the visualization
- Add queries with unique aliases
- Go to the Options Tab and setup panel:
- Choose visualization type
- Select metric in the Value -> Metric dropdown (by default, the first metric is used)
Demo
see demo
Options [Gauge]
- Visualization:
- Pod: option to select chart type
- Value:
- Metric: select metric query from dropdown
- Extemum:
- Min:
- type number for static minimum value OR
- enable "Use metric" toggle switch to select metric as minimun
- default value: 0
- Max:
- type number for static maximum OR
- enable "Use metric" toggle switch to select metric as maximum
- default value: maximum of metric query
- Min:
Installation
Linux / Mac OS X
-
Navigate to either:
<GRAFANA_PATH>/data/plugins(when installed from tarball or source)- or
/var/lib/grafana/plugins(when installed from.deb/.rpmpackage)
-
Download Chartwerk panel
wget https://gitlab.com/chartwerk/grafana-chartwerk-panel/uploads/2284215a4dc8fb3bde1fd3b51bd99d3e/corpglory-chartwerk-panel-0.5.0.zip
- Unpack downloaded files
unzip -u corpglory-chartwerk-panel-0.4.1.zip -d corpglory-chartwerk-panel
- Restart grafana-server
- For grafana installed via Standalone Linux Binaries:
- Stop any running instances of grafana-server
- Start grafana-server by:
$GRAFANA_PATH/bin/grafana-server
- For grafana installed via Package Manager:
- type in
systemctl restart grafana-server
- type in
- For grafana installed via Standalone Linux Binaries:
Grafana in Docker
You can install Chartwerk panel to Grafana in Docker passing it as environment variable (as described in Grafana docs)
docker run \
  -p 3000:3000 \
  -e "GF_INSTALL_PLUGINS=https://gitlab.com/chartwerk/grafana-chartwerk-panel/uploads/2284215a4dc8fb3bde1fd3b51bd99d3e/corpglory-chartwerk-panel-0.5.0.zip;corpglory-chartwerk-panel" \
  grafana/grafana