You can not select more than 25 topics
Topics must start with a letter or number, can include dashes ('-') and can be up to 35 characters long.
|
|
1 week ago | |
|---|---|---|
| .. | ||
| assets | 2 years ago | |
| components | 3 weeks ago | |
| grafana | 2 years ago | |
| models | 4 weeks ago | |
| README.md | 1 week ago | |
| module.test.ts | 2 years ago | |
| module.ts | 4 weeks ago | |
| plugin.json | 2 years ago | |
| types.ts | 4 weeks ago | |
| utils.ts | 3 weeks ago | |
README.md
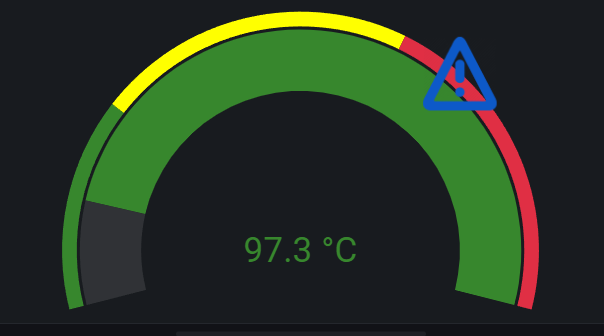
Grafana Chartwerk Panel (beta)
![]()
Grafana Chartwerk Panel renders metrics using Chartwerk libraries. For now, it can render as Gauge. We are working on adding new visualizations.
Features
- 3 types of visualizations:
- Gauge
- Line Chart (coming soon)
- Bar Chart (coming soon)
- Gauge: dynamic thresholds and min / max
- Gauge: conditional icons displaying
- Gauge: reversed direction
How to use
- Create a new panel and select Chartwerk as the visualization
- Add queries with unique aliases
- Go to the Options Tab and setup panel:
- Choose visualization type
- Select metric in the Value -> Metric dropdown (by default, the first metric is used)
Options [Gauge]
- Visualization:
- Pod: option to select chart type
- Value:
- Metric: select metric query from dropdown
- Extemum:
- Min:
- type number for static minimum value OR
- enable "Use metric" toggle switch to select metric as minimun
- default value: 0
- Max:
- type number for static maximum OR
- enable "Use metric" toggle switch to select metric as maximum
- default value: maximum of metric query
- Min:
Demo
see demo