You can not select more than 25 topics
Topics must start with a letter or number, can include dashes ('-') and can be up to 35 characters long.
2.6 KiB
2.6 KiB
Grafana Chartwerk Panel (beta)
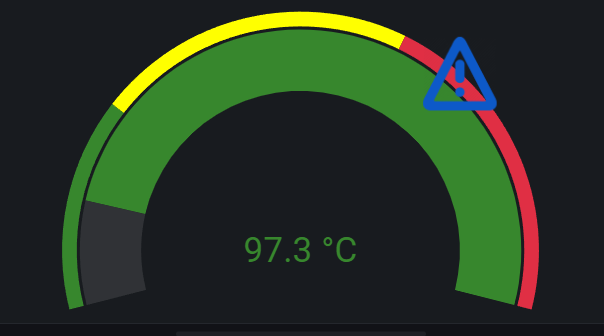
Grafana Chartwerk Panel renders metrics using Chartwerk libraries. For now, it can render as Gauge. We are working on adding new visualizations.
Features
- 3 types of visualizations:
- Gauge
- Line Chart (coming soon)
- Bar Chart (coming soon)
- Gauge: dynamic thresholds and min / max
- Gauge: conditional icons displaying
- Gauge: reversed direction
How to use
- Create a new panel and select Chartwerk as the visualization
- Add queries with unique aliases
- Go to the Options Tab and setup panel:
- Choose visualization type
- Select metric in the Value -> Metric dropdown (by default, the first metric is used)
Options [Gauge]
- Visualization:
- Pod: option to select chart type
- Value:
- Metric: select metric query from dropdown
- Extemum:
- Min:
- type number for static minimum value OR
- enable "Use metric" toggle switch to select metric as minimun
- default value: 0
- Max:
- type number for static maximum OR
- enable "Use metric" toggle switch to select metric as maximum
- default value: maximum of metric query
- Min:
Installation
Linux / Mac OS X
-
Navigate to either:
<GRAFANA_PATH>/data/plugins(when installed from tarball or source)- or
/var/lib/grafana/plugins(when installed from.deb/.rpmpackage)
-
Download Chartwerk panel
wget -O corpglory-chartwerk-panel-0.5.1.zip https://code.corpglory.net/attachments/e1c563fd-10bf-4cb4-be12-be76377f3f1c
- Unpack downloaded files
unzip -u corpglory-chartwerk-panel-0.5.1.zip
- Restart grafana-server
- For grafana installed via Standalone Linux Binaries:
- Stop any running instances of grafana-server
- Start grafana-server by:
$GRAFANA_PATH/bin/grafana-server
- For grafana installed via Package Manager:
- type in
systemctl restart grafana-server
- type in
- For grafana installed via Standalone Linux Binaries:
Grafana in Docker
You can install Chartwerk panel to Grafana in Docker passing it as environment variable (as described in Grafana docs)
docker run \
  -p 3000:3000 \
  -e "GF_INSTALL_PLUGINS=https://code.corpglory.net/attachments/e1c563fd-10bf-4cb4-be12-be76377f3f1c;corpglory-chartwerk-panel" \
  grafana/grafana
Demo
see demo
